IIRF Online > Business > Business Analytics & Intelligence > Tableau > 2024 Tableau Certified Data Analyst Training
2024 Tableau Certified Data Analyst Training by Udemy
(+40 Hours of Content) Tableau Public, Desktop, Prep, Online, Server, Bridge, Certifications
Course Highlights
- Gain a deep understanding of Tableau Public, Desktop, Prep, Online, Server, and Bridge from the perspective of a Professional Analyst
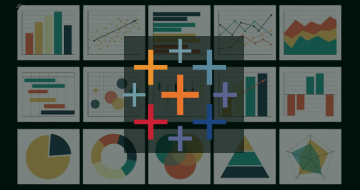
- Master the skills needed to create visually appealing and interactive data visualizations using Tableau
- Learn advanced techniques to manipulate and transform data in Tableau Prep
- Acquire the knowledge to publish and share data visualizations on Tableau Public, Tableau Online and Tableau Server
- Develop expertise in connecting to various data sources and creating data connections in Tableau
- Learn to build dynamic dashboards and interactive reports for effective data analysis and storytelling
- Discover best practices for designing intuitive and engaging data visualizations
- Understand the principles of data storytelling and how to effectively communicate insights through Tableau
- Prepare for Tableau certifications and gain confidence in passing them
- Increase your employability by understanding what employers and stakeholders value
Skills you will learn!
Curriculum
1 Topic
Downloadable Files and Resources
12 Topics
Welcome to the Course
Downloading Tableau Public (Links)
What is a Data Analyst and how to become Successful as one?
The IT Industry at large. Life as an analyst. Salary expectations.
Quick Tableau Demo
Entire Tableau Platform Explained
Which software is responsible for which part?
Tableau Pricing (Links)
Tableau for Students and Teachers (Links)
Tableau Public and Desktop Installation + Versions (Links)
Tableau Certification (Links)
What benefits does having Tableau Certification have?
33 Topics
Public vs Desktop. Accelerator Program Explained
Do I need the Paid Version of Tableau Desktop to do this course?
Data Set Explained + Visual Inspection (Download File)
Loading into Tableau and Data Source Interface Explained
Bonus: Text Qualifier (Just in case you have this Issue!)
Tableau Interface Explained
Data Visualization Basics
Getting Started with Bar Charts
Column Charts
When do we use Column Charts?
Bar and Column Formatting Basics
The Basics of Aggregation
What are the different types of aggregations?
Discrete and Continuous
Date Hierarchies
Formatting Line Charts - Colouring Splits Labels
Area Charts + Formatting
SHOW ME + Pie Charts and Basic Formatting
What is the quickest way to build a simple visualization in Tableau Desktop?
Running Totals - Running by Pane Basic Colouring Multiple Measures
Moving Average + Dual Axis Demonstration
Dashboard 1 - Building the Individual Sheets
Dashboard 2 - Compiling the Dashboard
What is the difference between Sheets and Dashboards in Tableau Desktop?
A Dashboard built by a Data Visualization Expert (Attached Packaged Workbook)
Different Ways to Export your Visualization and Data
Saving to Tableau Public (Links)
Bonus: Re-Establishing a Connection to a Downloaded Workbook from Tableau Public
Assignment Problem
Assignment Solution (Attached Packaged Workbook)
Congratulations on Finishing the Accelerator Program
Does this mean I'm a Professional Analyst now?
FREE eBook: Tableau - Inspiration in Colour
6 Topics
Welcome to the Beginner Section
Loading the Data and Data Inspection (Attached File)
Splitting Renaming Fields Data Type Changes
Live vs Extract Connections
Saving your file to Tableau Public and Downloading it Again (Link)
What is the difference between Live and Extract Connections?
5 Topics
Grouping and Aliases
Sorting - Manual - Alphabetical - Field
Aggregates - Count Min Max Average Median Distinct Count on String
Crosstabs Heat Maps and Totals
What does Grouping do?
12 Topics
Getting Started with Filters - Keep Only and Exclude
Filtering with a Field that's not in the Visualization
Filtering Discrete Dates - Right Click Drag Method
Filtering Continuous Dates
What is the difference between Discrete and Continuous dates in Tableau Desktop?
Relative Date Filtering
Filtering Measures - Aggregate vs Row Level Filtering
Pre-Filtering and Computational Efficiency Considerations
Displaying Filtering Controls - Best Practices
Filtering Strings - Different Filtering Display Options and Examples
Relevant Filtering
When should you pre-filter a data set in Tableau Desktop?
13 Topics
Hierarchies - Bonus Map Hierarchy Demo
Dual Axis 3 Examples - Basic 2 line Running Total combo chart Moving AVG
Measure Name and Values - Different Arrangements - Crosstab - Line - Bar
Getting Started with Formulas - ZN Function for Nulls
Arithmetic Functions
Scatter Plots - 3 Ways
What is the purpose of a scatter plot in Tableau Desktop?
Number Formatting and Default Formatting
Setting up your Regions Correctly for Map Visualizations
Getting Started with Maps - Dots and Boundary's plus basic formatting
Map Terrain Formatting Options
Density Plots
Measures allow us to view a maximum of two measures at a time side by side
12 Topics
Dashboard Actions - Example 1
Dashboard Actions - Example 2
Dashboard Actions - Example 3
What is the difference between a dashboard and a sheet in Tableau Desktop?
Adding Filters to Dashboards
Applying Filters to Multiple Sheets in a Dashboard
Assignment (Problem)
Assignment (Solution 1)
Assignment (Solution 2)
What is the purpose of a dashboard for a stakeholder in Tableau Desktop?
Congratulations and the Intermediate Section Described
Another FREE eBook!
9 Topics
Introduction and Topics Covered
Project Management Introduction - Topics Covered for Career Success
Philosophy - Mindset for Success
Agile vs Waterfall + Day in the Life of an Analyst
Managing Scope - Scope Creep Version Control
Assessing Impact
Designing for the Future - Daily 8 Hour Breakdown
Career - Final Thoughts to Become Successful
What is the difference between Agile Methodology and Waterfall in project manage
7 Topics
What is Data Cleansing
Data Inspection - Gaps Missing Data Pivot Structures
Data Exploration with Tableau - Metric Comparison to Ensure Tableau Reads
File Storage and Project Tracking (MANDATORY)
Ooooopssss.....I forgot to explain the actual data set story
Managing Multiple Connections - Replace Data Source Replace References
What is the goal of data cleansing in data analysis?
17 Topics
Data Splitting Automatic Custom Underlying Formula Explaining
Don't forget to save to Tableau Public
Replace Function
Left and Right Functions
Length Function + Bonus discussion on Discrete's and Dimensions
What is the purpose of data splitting in Tableau?
Mid Function
Mid Function + Length Function
Find Function
Find + Left
Findnth Contains Startswith Endswith
Trim + Lower + Upper
New Function: Proper()
LTrim and RTrim
Which of the following functions are used for text finding in Tableau?
Assignment - Clean Up Functions (Problem)
Assignment - Clean Up Functions (Solution)
5 Topics
Pivot vs Table Structure Theory - Physical Explanation of the Conversion
Extension Problem of Pivots - Be Careful with Aggregates
Setting up 2 Connections - Pivoted and Unpivoted
Pivot vs Table - What you can and can't do
In Tableau Desktop what is the difference between Pivot and Table structures?
3 Topics
Integers and Rounding
Ceiling Floor Absolute and Sign
Exponent Power Sin Cos Tan Degrees Radians Logs Square Root
12 Topics
The Basics of Logic and IF Functions
Boolean Examples - = for String Measures and Dates
IF vs IIF Syntax and Writing your first Functions
Applying to Row or Aggregate Level
What is an IF function?
AND and OR Function Examples
Nested IF Functions
Else If Function
Case Function
Special Logic Functions zn ifnull not isnull
Assignment - IF Functions (Problem)
Assignment - IF Functions (Solution)
8 Topics
Discrete and Continuous Dates Revisited (Different Combinations)
DatePart Function and the Discrete Representation
Makedate Function and New Trick to Clean up Incomplete Dates
DateDiff Function
DateAdd
Fiscal Year Start and Start of the Week Day
Today and Now Functions
Dynamic Field Calculations
20 Topics
Quick Table Variations Demonstration
Data Prep + Tables Panes and Cell
Warning! Can you spot the Mistake?
Tables Panes and Cells Direction in a Crosstab
Calculation Assistance
Dual Axis 2 Ways - Data Viz Best Practices
Difference
What does the difference function do?
Difference Function - Relative To Options
Percentage Difference
Percent of Total for Pie. Bar Chart Variations
Rank Function + Bonus - Bump Chart Explained
Percentile Function
Compound Growth Rate
YTD Total
YoY Growth
YTD Growth
What is the difference between Running Total and YTD Total?
Assignment - Quick Table Calculation (Problem)
Assignment - Quick Table Calculation (Solution)
3 Topics
Filtering Top and Bottom Shelf Calculation By Field By Formula
Condition Filtering
Wildcard Filtering Combination Filtering and the Summary
13 Topics
Maps Edit Locations Hierarchies
Map Best Practices - Dos and Don'ts
Background Layers
Creating Custom Regions and Groups
Region Maps Colouring Styling and Best Practices
Dual Axis Maps
Dual Maps with Pie Charts
Maps and Shapes
Multiple Maps by Splitting with Dimensions
Density Plots Revisited and Different Ways to Visualize
Annotations and Secrets to becoming a Great Analyst
Bar Charts vs Maps
Congratulations on Completing the Intermediate Section
2 Topics
Transition to 2023-24 Content
2023-24 Expert vs 2020 Expert
4 Topics
Introduction to Expert
Extracting the Zip Working File
Data Sets Explored
Mentality of Big Data Sets
22 Topics
Union Theory (Mismatched Fields Missing Fields etc.)
3 Different Methods for Unions
Wildcard Unions
Inner Join and Left joins Explained
Outer and Full Joins. Joins without Duplicates
Simple Join Example in Tableau
Big Join in Action - Left Side Setup and Validation
Big Join in Action - Right Side Setup
Big Join in Action - Performing the Actual Join and Interpreting Results
Numerical Validation and Assessing Risk of Join Choice
Joining with Duplicates (One-to-One and Many-to-Many Relationships)
Example of Many to Many Join with Duplicates
How do you deal with Unintended Duplicates
Double Join Theory
Double Joins in Action with Real Data
The Problem with Joins and Duplicate Data
The Solution is Relationships
Building the Full Data Model with Joins Relationships and Unions
Assignment - Joins and Relationships (Problem)
Problem 1 - Solution
Problem 2 - Solution
Problem 3 - Solution
17 Topics
Introduction to Parameters
What is a Parameter - A Simple Example
Simple Parameter using Float
Setting a Range for Float Parameters
Parameter List with % Example
Using the String Parameter with an If Function
Multiple String Parameters in Play with Aggregation Choice
Choosing Dimensions using Parameters
Using Parameters in a Scatter Plot
Date Parameters with Boolean Check
Changing Data Granularity
Filtering With Parameters
Using Actions to Change Parameter Values
Assignment (Problem)
Assignment (Solution 1)
Assignment (Solution 2)
Assignment (Solution 3)
11 Topics
Welcome to Sets - Recap on Groups Function
Demonstration of Different uses of Sets
Loading your Data - Creating a Basic Set Different Ways to Visualize
Combining Sets to See their Interactions - Venn Diagram Theory
Creating Crosstabs off Existing Sets
Using Sets in Downstream Analysis
Tableau Online - Publishing Data Sets Tableau Environment Collaboration
Combining Sets with Parameters
Using Actions to Controls Sets
Assignment - Problem
Assignment - Solution
22 Topics
Welcome to LODs
Basic Concept of Level of Detail and Granularity
Quick Example of Fixed LOD
Exclude LOD
Include LOD
Download all the Case Study's
Case Study 1 - Number of Unique Model Lines per Vendor ID + Action Function
Case Study 2 - Minimum Date + Quality Gates
Case Study 3 - Classification with Tolerance
Case Study 4 - LOD for the Whole Data Set
Case Study 5 - Comparing Minimum and Maximum Dates
Case Study 6 - Excluding Dates for User Choice Comparison
Case Study 7 - Include and Fixed Equivalency
Case Study 8 - Double Fixed LODs
Case Study 9 - Double Minimum Dates - Tricky
Case Study 10 - Median LODs
Case Study 11 - Min vs Max and Additional Calculations
Case Study 12 - Proportionality
Case Study 13 - Progression Percentage over Time
Case Study 14 - Fixing the Column Grand Totals for Filtering - Fixed vs Ex
Case Study 15 - Art and Creativity
Concluding Remarks
16 Topics
Introduction to Analytics Pane
Loading the Analytics Pane data set
Constant Line Setup and Formatting
Multiple Constant Lines Average Min Max Second Formatting Method
Median with Quartiles and Confidence Intervals
Recalculated Aggregate Lines - On or Off
Median vs Average
Median with Quartiles
Linking Parameters to Lines Reference Lines Boolean Colours
Reference Bands and Distribution Bands
Box Plots
Grand Total Options and Best Practices
Getting Started with Trendlines
Logarithmic and Power Trendlines
Forecasting
Clusters
21 Topics
19_01_Welcome to Dashboard Design Elements
19_02_Data Set Explained (Attach)
19_03_Exploratory or Explanatory Dashboards (Attach Packaged Workbook)
19_04_Dashboard Planning with MS Paint
19_05_Pie Charts and the Concept of Emphasis
19_06_Bar and Column Chart Principals
19_07_Hierarchy Maps + Story Time
19_08_Heat Maps - Super Simple
19_09_Line Chart Principals
19_10_Area Chart Do's and Don'ts
19_11_Tier Structure System of Dashboard Design
19_12_Filters or Visualizations for better User Experience
19_13_Dashboard Cleaning Assignment (Problem - Attach Packaged Wb)
19_14_Dasbhoard Cleaning Solution - Part 1
19_15_Dasbhoard Cleaning Solution - Part 2 (Attach Packaged Workbook)
19_16_Assignment - Tier System Problem (Attach Packaged Workbook)
19_17_Assignment - Tier System Solution Walkthrough
19_18_Assignment - Tier System Solution - Part 1
19_19_Assignment - Tier System Solution - Part 2
19_20_Assignment - Tier System Solution - Part 3
19_21_Assignment - Tier System Solution - Part 4 (Attach Pckg Wb)
20 Topics
Data Set (Attach)
20_01_Tiled and Floating Containers and Sheets
20_02_The Power of Text Boxes
20_03_Adding Images to your Dashboards
20_04_Microsoft Excel Image Editing Tricks
20_05_Adobe Express Image Creation and Editing (Links)
20_06_Colour Wheel and Colour Lovers (Links)
20_07_Creating AI Images using MidJourney and Discord (Links)
20_08_Export into Different Formats - Version Packaged PPT PDF
20_09_Extracting Data Out of Tableau Desktop - Excel Image MDB Crosstab
20_10_Navigation Menu and Buttons
20_11_The Importance of White Space - Blanks and Padding
20_12_Show and Hide Button for Filters and Visualization
20_13_Download Buttons - PDF Crosstab PPT Image
20_14_Tableau Extensions - Sorry I'm not an Expert on this One
20_15_Data Story Extension - AI Machine Learning and Natural Language
20_16_Ask Data - Building Visualizations using Text (Bonus Tableau Environment)
20_17_Mobile and Tablet View Creation
20_18_Dashboard Objects Assignment (Problem - Attach WB)
20_19_Dashboard Objects Assignment (Solution - Attach WB)
14 Topics
21_01_Dashboard Actions Introduction
21_02_IMDB Top 250 Movies Data Set (Attach)
21_03_Building the Visualizations
21_04_Building the Dashboard + How Actions work Under the Hood
21_05_Ignore Actions
21_06_Building Action Filters from Scratch
21_07_Select and Deselect Behaviour Options
21_08_Filtering on Specific Dimensions
21_09_Actions instead of Filters Please
21_10_Highlight Action
21_11_Go to Sheet and Go to URL Actions
21_12_Deploying Dashboards with Actions and How to Reset Them on Tableau Online
21_13_Assignment Problem (Attach Packaged Workbook)
21_14_Assignment Solution (Attach Solution)
13 Topics
22_01_Tableau Story Telling (Provide Link)
22_03_Explanatory vs Exploratory Dashboards
22_04_Career Advice to get to $200k a year
22_05_Planning the Work Ahead - Developing your Research Questions
22_06_Building the Visualizations - Part 1
22_07_Building the Visualizations - Part 2
22_08_Building the Visualization - Part 3
22_09_Building the Visualizations - Part 4
22_10_Building your First Story
22_11_Building the Aesthetics of your Dashboards
22_12_Publishing to Tableau Online for Job Show Cases
22_13_Using Stories to Build the Fastest Dashboards Ever
Final Dashboard Download
24 Topics
23_01_Custom Visualizations Here we Come
23_02_Loading the Data Set (Attach)
23_03_Histograms and Bins
23_04_Scatter Plots and Bins
23_05_Scatter Plot with Maps
23_06_Multi-Dimensional Scatter Plots
23_07_Dynamic Scatter Plot
23_08_Funnel Charts
23_09_Building a Corporate Dashboard with Metrics
23_10_Gantt Chart
23_11_Calendar Visualization
23_12_KPI Chart - Actuals vs Forecast
23_13_Bump Charts
23_14_Waterfall Chart
23_15_Word Clouds
23_16_Map Control
23_17_Visualization in a Tooltip
23_18_Jitter Plots
23_19_Donut Charts
23_20_Packed Bubble
23_21_Hierarchies and Tree Maps
23_22_Sparklines
Workbook Download
23_23_Congratulations
1 Topic
2020 Content from Here
17 Topics
Congratulations! Tableau Public Tour!
Thank you my Beautiful and Lovely Students!
Welcome to the Expert Section
Methods for Unioning Data
Wildcard Union for Multiple Sheets and Multiple Documents
Unioning Sheets from Excel - WORKAROUND Method
Extracting Information from the Path or Sheet Data Fields
Tableau 2020 - Joins and Blends Explained
Basic Join Theory - One to One (PDF Cheat Sheet)
Many to Many Joins
Your First Single Join - The Ambassadors
More Single Join Examples + Excel Comparison Example
CHALLENGE - Multiple Single-Joins (Spiderweb Design)
Multi-Joins x2 Examples
Joining Non-Excel Files Together (CSV Excel Access)
Joining Before or In Tableau
Data Blending
9 Topics
Reference Line Basics
Controlling the Range of Values
Top 10 Parameter Example and Scatter Plots
Multiple Parameters and Analysis on the Fly
Using Parameters to Change the Visualization Field
Parameter Data Type Options
Introduction to Sets Creating and Overlapping
Sets Analysis - Looking at Overlaps using Condition Sets
Performing IF Functions on Sets
3 Topics
Level of Detail - Fixed
Level of Detail - Exclude
Level of Detail - Include
15 Topics
Histograms - Details and Quick Method
Funnel Graphs
Gantt Charts - Multiple Methods (Attach Data)
Bump Bump Bump
Donut Charts...mmmmmm Donut
Packed Bubbles
Hierarchy and Tree Maps
Maps on a Scatter Plot
Dot Time and Jitter Plot
Waterfall Chart
Calendar and Large Heat Maps
Moving Average Dual Axis
Mapping Paths - Simple and Complex
London Pathways
A Simple Mapping Dashboard (Bonus Video)
10 Topics
Introduction to Actions - Hover Select Menu
Single Select Function and Deselect Bahaviour
Target Filters and Actions
Highlight URL and Go To Sheets
Actions to Change Parameters
Actions to Control Sets
Ignore Actions
The Power of Animation in Telling Stories
Introduction to Animation using Pages
Pages - Dashboard and Synchronization
7 Topics
Tableau Mobile: iPads iPhone Tablets and Android
Mobile and Tablet View Design
Who are you building for and what are you telling them
Dashboards - The Good The Bad and The Ugly
Fail Fast Development
Story Mode Creation
Story Mode Creation Tips and Advice
6 Topics
What is Tableau Online and How Much
Site Creation
Dashboard Design and Publication
Collaboration 1: Favorites Project Details Custom Views and Subscriptions
Collaboration 2: Web Editing Comments Share View Embed and Alerts
Collaboration 3: Revert Refresh Data Details Downloads and Mobile/Tablet
13 Topics
Tableau Online vs. On-Premises vs. Cloud
User Management - Add Users CSV Import and Site Roles
Site Roles
License Management and Purchasing
Data Governance - Principles
Data Governance - Dashboard Views and Site Performance
Published Data Sources Part 1
Published Data Sources Part 2
Permission Setting at a Dashboard and Project Level
"Ask Data" Natural Language Processing (NLP)
Tableau Bridge
Tableau "Explain Data" (In Production)
Tableau Conductor (In Production)
17 Topics
Tableau Prep
Installation Concept and Pricing
Raw Data Sets Explained - The Dirty Super Store
Loading your Data - Menu Explained
Cleaning Step - Interface Explained
Renaming Fields Keep Only Exclude Data Types
Branches Multiple Outputs Outputting your Results - CSV Hyper Preview
Remapping a File to a New Location
Data Interpreter and NotePad Plus
Filtering Numbers and Strings
Grouping and Replacing
Ungrouping
Cleaning Text - Spaces Letters Numbers Punct REPLACE
Automatic and Custom Splitting
Replace with Null
Using Aggregates
Unpivotting
11 Topics
Introduction to Unions
Wildcard Unions
Join Types Explained and PDF Download
Single Join Example and your First Connection
Single Join - More Examples and Rebuilding Joins
Multi-Joins and Troubleshooting
If functions IsNull Not Null IfNull AND/OR
Rounding Decimal Places Integer Function Absolute
Left Right Mid and Concatenate
Find and Replace
Date Functions - Year Month Day Now Today
8 Topics
Sample Data Sets Reference
File Index Links and Inspiration
Group 1
Group 2
Group 3
Group 4
Group 5
Group 6

2024 Tableau Certified Data Analyst Training
Related Tableau Courses


Thank You!
Your review has been submitted successfully.