IIRF Online > Finance & Accounting > Financial Modeling & Analysis > Excel > Microsoft Excel: Data Visualization w/ Excel Charts & Graphs
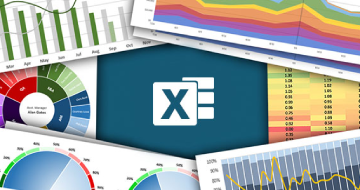
Microsoft Excel: Data Visualization w/ Excel Charts & Graphs by Udemy
Master 20+ Excel charts & graphs, build custom dashboards, and create advanced spreadsheet visuals w/ a top instructor!
Course Highlights
- Understand WHEN, WHY, and HOW to use 20+ chart types in Excel 2016+
- Learn advanced Excel tools like automated dashboards, scrolling charts, dynamic formats, and more
- Master unique tips, tools and case studies that you won't find in ANY other Excel course, guaranteed
- Explore fun, interactive, and highly effective lessons from a best-selling Excel instructor
- Get LIFETIME access to project files, quizzes, homework exercises, and 1-on-1 expert support
- Build 10+ Excel projects designed to take your data visualization skills to the next level
Skills you will learn!
Curriculum
4 Topics
Course Structure & Outline
READ ME: Important Notes for New Students
DOWNLOAD: Course Resources
Setting Expectations
3 Topics
Key Visualization Principles & The 10-Second Rule
Good Bad & Ugly Data Viz
3 Key Questions for Effective Visualization
5 Topics
Customizing Chart Elements Layouts & Styles
Configuring Chart Formats
Changing Chart Types & Adding a Secondary Axis
Creating & Applying Custom Chart Templates
Excel Chart Customization
35 Topics
DEMO: Excel Bar & Columns Charts
HOMEWORK: Bar & Column Charts
DEMO: Excel Histograms & Pareto Charts (Office 365/Excel 2016+)
HOMEWORK: Histograms & Pareto Charts
DEMO: Excel Line Charts & Trendlines
HOMEWORK: Line Charts & Trendlines
DEMO: Excel Area Charts
HOMEWORK: Area Charts
DEMO: Excel Pie Charts Donuts & Race Tracks
HOMEWORK: Pies Donuts & Race Tracks
DEMO: Excel Scatter Plots
DEMO: Excel Bubble Charts
HOMEWORK: Scatter Plots & Bubble Charts
DEMO: Excel Box & Whisker Charts (Office 365/Excel 2016+)
HOMEWORK: Box & Whisker Charts
DEMO: Excel Tree Maps & Sunburst Charts (Office 365/Excel 2016+)
HOMEWORK: Tree Maps & Sunburst Charts
DEMO: Excel Waterfall Charts (Office 365/Excel 2016+)
DEMO: Excel Funnel Charts (Office 365/Excel 2016+)
HOMEWORK: Waterfall & Funnel Charts
DEMO: Excel Radar Charts
HOMEWORK: Radar Charts
DEMO: Excel Stock Charts
HOMEWORK: Stock Charts
DEMO: Excel Heat Maps with Conditional Formatting
HOMEWORK: Heat Maps
DEMO: Excel Surface & 3D Contour Charts
HOMEWORK: Surface & Contour Charts
DEMO: Geo-Spatial Mapping with Excel Power Map
HOMEWORK: Power Map
DEMO: Common Excel Combo Charts
HOMEWORK: Combo Charts
DEMO: Excel Sparklines
HOMEWORK: Sparklines
Basic Excel Chart Types
14 Topics
Setting Expectations
DEMO: Creating Custom Image Overlay Charts
DEMO: Using Binary Values to Highlight Time Periods
DEMO: Automating Charts with Named Ranges (OFFSET & COUNTA)
DEMO: Adding Scroll & Zoom Functionality Using Form Controls
DEMO: Creating Interactive Area Charts to Show Changes Over Time
DEMO: Building a Dynamic Excel Dashboard (Part 1)
DEMO: Building a Dynamic Excel Dashboard (Part 2)
DEMO: Dynamic Chart Formatting Based on Values
DEMO: Dynamically Highlighting Segments of Data
DEMO: Building a Custom Excel Pacing Chart
DEMO: Designing a Custom Excel Gauge Chart
DEMO: Visualizing Percentages Using Array Functions
Advanced Excel Data Visualization Techniques
1 Topic
BONUS LESSON
Microsoft Excel: Data Visualization w/ Excel Charts & Graphs
Related Excel Courses


Thank You!
Your review has been submitted successfully.