IIRF Online > Office Productivity > Google > Google Sheets > Master Reporting Automation with Google Sheets
Master Reporting Automation with Google Sheets by Udemy
Learn How To to Build A Completely Automated Reporting Tool & Solve Any Business Modeling Task You Might Ever Experience
Course Highlights
- Advanced Google Sheets / Excel formulas that help you to solve any business modeling task you might ever experience
- How to make your files look professional and easy-to-track
- Creating highly complex formula combinations that will save you hours of time from automating manual work
- How to minimise manual reporting and focus on value-creating tasks
- Analytical skills on how to approach competitor analytics and market size estimation
- Tips and tricks to effective data visualisation
- Create an automated business forecasting framework that works
- How to build a complete reporting system in Google Sheets with maximum automation
- Ideas how to combine Google Sheets with (Python) scripts
- Secrets how to impress your colleagues with your exceptional Excel skills
Skills you will learn!
Curriculum
5 Topics
Introduction
Why Google Sheets not Excel?
Quick Example: How to Efficiently Automate Reporting
Overview of Course Projects
Your Feedback is Valuable
10 Topics
Introduction
Key Formula Combination - INDEX & MATCH
Determining Year with TEXT
Smart use of IF's - Dynamic SUMIF and AVERAGEIF
Use of COUNTIF(S)
Identify ROW & COLUMN Numbers
RANK the Data
Avoid Errors with IFERROR
Improve Calculation Accuracy with AVERAGE.WEIGHTED
Key Formula Quiz
8 Topics
Introduction
Pulling Data with INDIRECT & ADDRESS
Use OFFSET for Dynamic Calculations
IMPORTRANGE with INDEX & MATCH
Advanced Formula: QUERY
Advanced Formula: QUERY 2
Section Recap
Key Formula 2 Quiz
8 Topics
Introduction
Mapping Down the Metrics
Defining the Week Periods and Week References
Connecting the Formulas with INDEX & MATCH
Setting Up Budget Connections and Calculations
Formatting of Week Numbers
Visual Formatting
Project Mapping Quiz
11 Topics
Introduction
Defining Sheet Structure
Setting Up Forecasting Formulas
Advanced: Connecting Stable Metrics to Dataset
Linking Targets with Actuals
Defining Current Week through TODAY Formula
Target Conversion from Weekly to Monthly
Comparison between Targets and Budgets
Notification for Reconciliation with Budgets
Sections Recap
Forecasting Quiz
9 Topics
Introduction
Defining Sheet Structure
Connecting the Formulas
Not Showing Data for Unpassed Weeks
Calculating the Variances
Conditional Formatting for Variances
Conditional Color Notifications
Final Touches
Comparison Building Quiz
7 Topics
Introduction
What to Include in the Cover tab?
Table of Contents
Linking Key Information
Use Your Brand Colours
Section Recap
Landing Page Quiz
7 Topics
Introduction
Defining Sheet Structure
Connecting the Data to the Tab
Color Coding for Weekly Trends
Color Coding for Monthly Budgets
Final Touches
Actuals vs Budget Quiz
10 Topics
Introduction
Defining Sheet Structure
Creating the Framework for Competitor Tracking
Adding Formulas to Framework
Estimating Competitor and Market Size
Summary of Key Metrics
Final Touches
Connection with Other Tabs
Sections Recap
Market Sizing Quiz
11 Topics
Introduction
Intro to the First Graph
Data Visualisation Principles
Graph I: Key Actuals with Targets
Graph II: Monthly Actuals with Budgeted Forecasts
Dynamic Table: Data Layout for Competitor Tracking
Dynamic Table: Ranking for Competitor Tracking
Graph III: Tracking Weekly Performance over Monthly Budget
Final Touches
Section Recap
Data Visualisation Quiz
6 Topics
Introduction
Status for Data Dump
Dynamic Budget Connection with IMPORTRANGE & TRANSPOSE
Dynamic Budget Connection with QUERY
Final Touches
Data Connections Quiz
7 Topics
Introduction
Adding Instructions
Reviewing Links in Cover tab
Final Touches on Whole File
Protecting the Sheets
Recap of Course Project
Project Wrap-Up Quiz
8 Topics
Introduction
Automating Data Dump through a Script
Creating Multi-Level Reporting System
Optimise Spreadsheet Performance
Workaround for IMPORTRANGE Internal Errors
Manage Reporting Files through Scripts
Section Recap
Tips and Tricks Quiz
2 Topics
Conclusion
Bonus Lecture
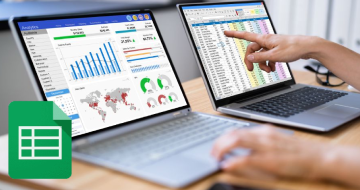
Master Reporting Automation with Google Sheets

