IIRF Online > Finance & Accounting > Financial Modeling & Analysis > Excel > Introduction to Excel Charts for Data Visualisation
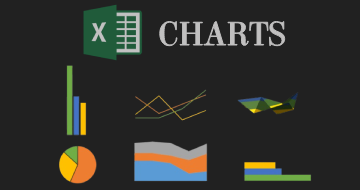
Introduction to Excel Charts for Data Visualisation by Futurelearn
Learn the basics of charting in Excel, from creating and formatting charts, to the pros and cons of each different type of chart.
Course Highlights
- Design easy to read charts and data visualization
- Identify good and bad charts and data visualization
- Explain the principles of good data visualization
- Create common and less common Excel Charts
- Demonstrate and apply Excel chart formatting options
- Develop an Excel dashboard using visualizations
- Present data with visually effective charts
Skills you will learn!
Curriculum
5 Topics
Inserting charts in Excel
Formatting Excel Charts
Working with common Excel charts
Working with less common Excel charts
Charting Fundamentals
Introduction to Excel Charts for Data Visualisation
Related Excel Courses


Thank You!
Your review has been submitted successfully.