IIRF Online > Finance & Accounting > Money Management Tools > Excel Analytics > How to Use Microsoft Excel for Data Analysis
How to Use Microsoft Excel for Data Analysis by Futurelearn
Improve your skills using Microsoft Excel and associated Excel features, to better report and analyse your data.
Course Highlights
- Demonstrate how to create flexible data aggregations using pivot tables
- Apply how to represent data visually using pivot charts
- Explain how to create aggregate reports using formula based techniques
- Calculate margins and other common ratios using calculation on pivot table
Skills you will learn!
Curriculum
8 Topics
Welcome to the Course!
Introduction to Reporting in Excel
CloudSwyft Hands-On Lab 1
Excel Tables
CloudSwyft Hands-On Lab 2
Basic Pivot Tables
CloudSwyft Hands-On Lab 3
Wrapping up the Week
11 Topics
Dashboards
CloudSwyft Hands-On Lab 4
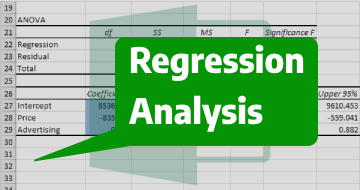
Profitability Analysis and Finding Anomalies
CloudSwyft Hands-On Lab 5
Comparative Data in Pivot Tables
CloudSwyft Hands-On Lab 6
Reporting Hierarchical Data
CloudSwyft Hands-On Lab 7
Introduction to Multi-Table Pivot Tables and the Data Model
CloudSwyft Hands-On Lab 8
Wrapping up the Course
How to Use Microsoft Excel for Data Analysis
Related Excel Analytics Courses


Thank You!
Your review has been submitted successfully.