IIRF Online > Office Productivity > Google > Google Looker Studio (Data Studio) > Looker Studio /Google Data Studio Complete Advanced Tutorial
Looker Studio /Google Data Studio Complete Advanced Tutorial by Udemy
Learn the best Cloud based BI tool - Looker Studio / Google Data Studio - & Create Exceptional Reports in minutes !
Course Highlights
- Know about Google Data Studio as an Enterprise Level BI tool
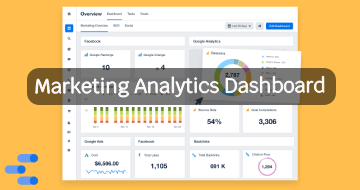
- Learn how to use Google Data Studio to create Interactive and Beautiful Dashboards
- Practice along how to connect to various Data Sources with Live Examples
- All the Chart Types in Google Data Studio like Bar, Time Series, Geo Maps, Scatter Plots etc and how to configure each of them
- Sharing Reports as is, as Customized bookmarks or as Templates
- Embedding external content like Websites in your Report, and also embedding your report in your Website with Live Example.
- Add Action Controls like Dropdowns, Sliders and other Filter controls in your report to add user interactivity
- How to Blend data from different Tables to bring together to create one report
- Create Tricky Calculated Fields and Parameters
- Advanced Features like REGEX(Regular Expressions), Filter by Email, Parameters, Report Publishing etc
- Using Community Visualizations and Built in Templates to get your working report ready quickly.
- Best Chart Practices to create useful, interactive, feature-rich and beautiful Reports.
Skills you will learn!
Curriculum
5 Topics
Welcome
What is Google Data Studio ?
Benefits and Limitations of Google Data Studio
Learning Objectives
Resources
3 Topics
Signing up for Google Data Studio
GDS Glossary
GDS Home Page Interface Walkthrough
9 Topics
Connecting to a Data Source - CSV Google Sheets etc
Data Modeling - Understanding Dimensions & Metrics
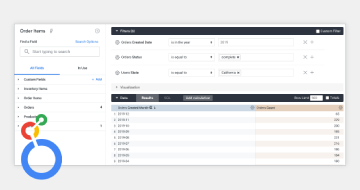
Data Source Editor Window Interface Walkthrough
Data Transformations
Embedded and Reusable Data Sources
Manage Data Freshness
Performing Data Union in GDS
Data Blending Process in GDS - Equivalent to JOINs
Sources to get Public Datasets
1 Topic
Report Editor Interface Walkthrough
18 Topics
Creating Charts - Table Visualization
Other Variations of Table Visualizations
Scorecards
Timeseries Chart
Bar Charts
Pie and Donut Charts
Google Maps Chart
Google Maps Chart Limitations
Geography Chart
Line Charts
Diff between Line chart & Timeseries charts
Area Chart
Scatter Plot
Pivot Tables
Bullet Chart
Treemap Charts
Gauge Chart
Adding Community Visualizations
5 Topics
Introduction to Adding controls in GDS Reports
List Box Controls
Input Box
Slider & Checkbox
Date & Data Control
14 Topics
Creating Groups of Components
Order & Arrangement of Components
Adding and Managing Pages
Sections & Dividers
Managing Page Navigation
Copying Chart Formatting
Creating Page level & Report Level Components
Adding & Managing Bookmarks
Embedding Items to your GDS Reports
Embed a GDS Report in your Website
Adding Images text Shapes and lines
Adding and Managing Filters in GDS
Using and Creating GDS Templates
Creating Thumbnail of your GDS Reports
1 Topic
How to use 'Explorer'
2 Topics
How to Share your Reports
Presenting your GDS Report
2 Topics
Getting Help
Troubleshooting – Missing Data
7 Topics
Tips for Improving Performance
Using Filter by Email option for Security Purposes
Understanding Regular Expressions REGEX
REGEX Demo
Data Segments in Google Analytics Property
Report Publishing Concept in GDS
Using Parameters in GDS
3 Topics
Charting Best Practices
How to choose the right Visualization?
Tips to create an effective Report
3 Topics
Summary of Steps to create your GDS Report
Next Steps
Congratulations !
Looker Studio /Google Data Studio Complete Advanced Tutorial
Related Google Looker Studio (Data Studio) Courses


Thank You!
Your review has been submitted successfully.