IIRF Online > Office Productivity > Google > Google Looker Studio (Data Studio) > Dynamic Dashboards and Data Analysis with Looker Studio
Dynamic Dashboards and Data Analysis with Looker Studio by Udemy
Learn how to build powerful data visualizations and unlock insights with ease in Looker Studio
Course Highlights
- Understand the art of capturing data-driven insights and visual storytelling
- Use all chart types throughout the course (Bullets, Pie Charts, Scorecards, Scatter plot and etc.)
- Get familiar with Google BigQuery for Google Data Studio
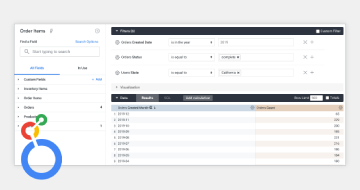
- Build advanced dashboards with pivot tables and use the "Expand-collapse" function
- Connect and blend data sources, and learn about dimension cardinlity
- Build a user journey funnel with Google Analytics data (Practical Example #1)
- Create a device breakdown visualization with user-level data (Practical Example #2)
- Create custom dimensions with conditional expressions (CASE + REGEXP_MATCH + IN)
- Explore dashboard design and conditional formatting
- Create time series with rolling dates and interaction filters
- Get a FREE dashboard template
Skills you will learn!
Curriculum
5 Topics
Welcome to the Course!
Creating your Google Data Studio account
Introducing the concepts of connectors and data flow
Setting up the course data sets in Google Sheets
Using the Data Studio Solutions Manual
4 Topics
Understanding aggregation and data schemas
Creating a pivot table and using the "Expand-collapse" function
Creating a comparative heat map pivot table with filters
Knowledge Check
7 Topics
Creating your first calculated field
Applying style settings to your metrics
Understanding "Local" and "Global" scope
Creating a custom dimension with conditional expressions (CASE + IN)
Using a regular expression (REGEX_MATCH) to alter an existing dimension
Applying IF statements within a CASE and using operators
Knowledge Check
7 Topics
Creating a time series and exploring date formats
Applying advanced date filters and compare date ranges
Automating reports with advanced date selection
Using interaction filters (Geo and Tree Map Charts)
Configuring a Gauge chart with a single metric
Adding range limits to specify threshold values
Knowledge Check
5 Topics
Blending two data sources and understanding the concept of a JOIN
Creating blended calculated fields
Configuring tables with multiple join keys and exploring cardinality
New JOIN Configuration and Operators in Google Data Studio [2022]
Knowledge Check
4 Topics
Connecting Google Analytics Demo account to Data Studio
Part 1: Creating a User Journey Funnel with Google Analytics
Part 2: Synchronize segments with Google Analytics and applying extra filters
Practical Activity
4 Topics
Understanding user-level data and granularity
Part 1: Creating a device breakdown view in your report
Part 2: Interpreting user-level data with a scatter plot
Practical Activity
8 Topics
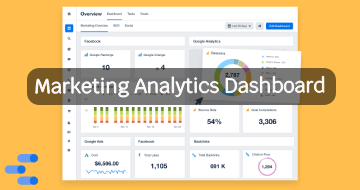
A framework for designing an insightful and intuitive dashboard
Using conditional formatting and exploring rule sequencing
Selecting a field as an input value in conditional formatting
Applying OR and AND statements to Google Ads keyword data
Adding multiple pages and applying different report navigation styles
Extracting a theme and color scheme from an Image/URL
Using presentation mode and exploring the Data Studio streamlined toolbar
Knowledge Check
5 Topics
Permission levels: Data Source and Report Access
URL Embedding PDF Downloads Version History and Scheduling
Report publishing functionality: "Published" vs "Draft" mode
Creating custom e-mail schedules for your reports
Knowledge Check
4 Topics
Creating a Google Cloud Platform (GCP) account for free
Creating a GCP project and configuring data sets within BigQuery
Running a SQL query and visualizing the output table in Google Data Studio
Knowledge Check
4 Topics
Why is reporting automation important?
What is Supermetrics and how to create a free trial account?
Connecting and automating Facebook Ads data in Data Studio
Knowledge Check
1 Topic
Create a dashboard in 10 minutes and get feedback to improve your skills!
8 Topics
Next Steps
FREE Dashboard Template
Advanced Page and Report Navigation in Google Data Studio – 2021
Top 5 Most Useful Calculated Fields and Functions in Google Data Studio
3 Ways to Use Google Data Studio for Benchmarks and Sales Targets
How to filter metric values with a slider control in Google Data Studio?
How to use parameters in Google Data Studio in 2021?
BONUS: 20% OFF a Supermetrics subscription (conditions apply)

Dynamic Dashboards and Data Analysis with Looker Studio
Related Google Looker Studio (Data Studio) Courses


Thank You!
Your review has been submitted successfully.