IIRF Online > Office Productivity > Google > Google Looker Studio (Data Studio) > Complete Introduction to Looker Studio (Google Data Studio)
Complete Introduction to Looker Studio (Google Data Studio) by Udemy
Learn how to create powerful data analysis, reports and dashboards with Looker Studio (formerly Google Data Studio)
Course Highlights
- Enjoy CLEAR and CONCISE step by step lessons from a best selling Udemy instructor in FULL HD 1080 P
- Learn from an Instructor with over 10 years teaching Data Analysis and Dashboard Design
- Create POWERFUL Interactive Dashboards from Google Sheets Data in Minutes
- Analyze Google Sheets in MINUTES using powerful visualizations and reports
- Create Year to Date, Month to Date, Week to Date Calculations with the click of the mouse
- Learn to SHARE and COLLABORATE using Reports and Dashboards of data
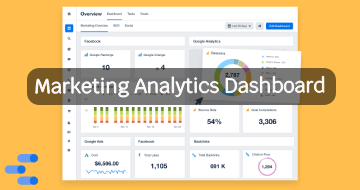
- Create powerful SCORECARDS displaying Key Metrics and KPIs
- Create TIME SERIES graphs that easily display Month to Date, Previous Month and many more
- Display COMPARISONS to Previous Periods
- Create FILTERS to easily create interactive dashboards, graphs and reports
- Learn powerful VISUALIZATIONS such as Column, Bar, Pie, Scatterplot
Skills you will learn!
Curriculum
6 Topics
Introduction to the Course
About the Course
Download the Google Sheets Training Data
Loading Data into Google Sheets
Connecting to Google Data Studio
Overview of Google Data Studio
7 Topics
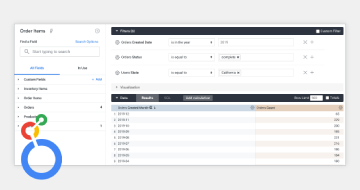
Introduction to Tables
Creating Tables
Formatting and Sorting Tables
Multiple Measures
Conditional Formatting
Practical Activity
Completed Practical Activity
8 Topics
Introduction to Methods of Aggregation
Methods of Aggregation
Practical Activity - Methods of Aggregation
Completed Practical Activity - Methods of Aggregation
Comparison Calculations
Running Total Calculations
Drill Down
Working with Dates
6 Topics
Introduction to Pivot Tables and ScoreCards
Creating Pivot Tables
Comparison Calculations
Card Visualization
Practical Activity
Completed Practical Activity
8 Topics
Introduction to Slicers and Visualization Filters
Text Slicers
Numeric Slicers
Date Slicers
Text Visualization Filters
Numeric Visualization Filters
Date Visualization Filters
Example Filter
9 Topics
Introduction to Custom Calculations
Create Calculations
Practical Activity
Completed Practical Activity
Year Month and Day
Case Statement
Practical Activity
Completed Practical Activity
Comparisons
2 Topics
Introduction to Case Study
Extract Data Case Study
8 Topics
Introduction to Time Series Graphs
Create Time Series Graphs
Changing Time Periods
Styles and Formatting
Time Series Chart Options
Area Graph
Practical Activity
Completed Practical Activity
7 Topics
Introduction to Other Visualizations
Column and Bar Graphs
Pie Graphs
Geographical Analysis
TreeMap Graph
Scatterplot Graph
Custom Visualization
4 Topics
Introduction to Dashboards
Publish and Sharing Interactive Dashboards Section
Create Dashboard
Sharing Dashboards
6 Topics
Introduction to Case Studies
Download the Training Data Files
Preparing Files for Data Blending
Data Blending
Data Explorer
Google Analytics
1 Topic
Conclusion

Complete Introduction to Looker Studio (Google Data Studio)
Related Google Looker Studio (Data Studio) Courses


Thank You!
Your review has been submitted successfully.