IIRF Online > Office Productivity > Google > Google Looker Studio (Data Studio) > Build Insightful Dashboards with Google Data Studio
Build Insightful Dashboards with Google Data Studio by Udemy
Create powerful data visualisations within minutes from google analytics and google sheets to speed up time to insight
Course Highlights
- Connect to a range of Data Sources (Google Analytics, Google Sheets)
- Get started with a FREE Data Studio Account
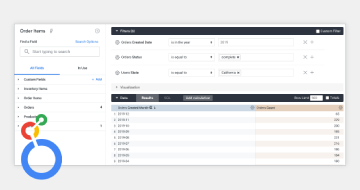
- Create and customise a range of data visualisations (scorecards, time series charts, bar charts, area charts, tables)
- Create re-usable report templates that follow best practice principles to share with collegues
- Create advance visualisations (maps, scatter charts, bullet charts)
- Add dynamic date and dimension filters to make dashboards interactive
- Tell powerful stories from your data
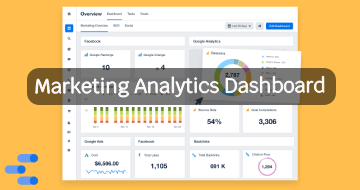
- Confidently create interactive analytical dashboards with your own Data
- Complete a final assignment and receive feedback on your final dashboard
Skills you will learn!
Curriculum
1 Topic
What you will learn and what you will gain
8 Topics
Introduction to the Homepage
EXERCISE - Create your Data Studio Account - FOR FREE!
An Introduction to Data Sources
EXERCISE - More about Data Sources
Connecting to Google Analytics Sample Data
EXERCISE - Connecting your own Google Analytics Data
The Reporting Interface
EXERCISE - Customising your Layout
14 Topics
Scorecards for your KPIs and Comparisons
EXERCISE - Additional Scorecard Customisations
Time Series Charts for Analysing Trends
EXERCISE - More Options for Time Series Charts
Bar Charts for making Comparisons
EXERCISE - Bar Chart Options
Tables for Presenting Detail
EXERCISE - Customise your Tables
Add new pages to your Report
Use a Pie Chart (if you really need to) to show Categorical Data
EXERCISE - Pie Chart Customisation
Add an Area Chart to segment your data
EXERCISE - 100% Stack your Area Chart
How Date Comparisons Work
4 Topics
Filtering by Date
EXERCISE - Date Range Filters
Filtering by Dimensions
EXERCISE - Dimension Filters
7 Topics
The Map Visualisation
EXERCISE - More about Maps
Exploring Data with Scatter Charts
EXERCISE - Scatter Charts
Bullet Charts for Showing Targets
EXERCISE - Everything to know about Bullet Charts
Adding Heatmaps and Bar Charts to Tables
2 Topics
The Explorer
The Explorer - Further Reading
2 Topics
Sharing your Reports
Exercise - Accessing your Dashboards in Google Drive
4 Topics
Data Sources - Connect your Google Analytics Data
NEW INTERFACE - Data Sources
Handling Sampling in Google Analytics
EXERCISE - Read more about sampling in Google Analytics
2 Topics
Preparing Data in Google Sheets
Connecting Google Sheets to Data Studio
2 Topics
Calculated Fields - Simple Arithmetic
EXERCISE - Create your own Custom Metrics
1 Topic
Create a Dashboard from Scratch - Analyse 2750 Ramen Reviews!
1 Topic
What you have Learned and Final words
5 Topics
Data Studio Help Forum & Requesting Features
Tracking Usage of your Data Studio Reports
Why Data Studio? Understanding if it's the right tool for you.
INFO - Comparing Business Intelligence Tools
Advanced Course & Promotoional Code

Build Insightful Dashboards with Google Data Studio
Related Google Looker Studio (Data Studio) Courses


Thank You!
Your review has been submitted successfully.