IIRF Online > Business > Business Analytics & Intelligence > Tableau > Tableau Data Analyst/Specialist Desktop Certification
Tableau Data Analyst/Specialist Desktop Certification by Udemy
From beginners to skills needed for Data Analyst or Desktop Specialist certifications. Tableau 2023, 2022, 2021, 2020
Course Highlights
- Download for free and install and run the full version of Tableau Public, the BI and analysis software.
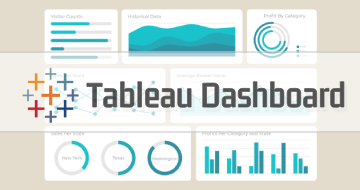
- Be able to create analyses, such as line charts, stacked bar charts, or geographic analyses using maps.
- You will also be able to show an overview using dashboards, and tell a story using storyboards.
- You will be able to format numbers and dates, and add labels, tooltips and animation.
- You can also become used to more advanced features, such as Calculated Fields, Parameters and Hierarchies.
- By the end of the course, you will, with some experience, have the knowledge to take (and pass) the Tableau Qualified Associate certification.
Skills you will learn!
Curriculum
8 Topics
Introduction
Welcome to Udemy
Introduction to Udemy
Do you want auto-translated subtitles in more languages?
What are we going to create?
Curriculum
Resources
Downloading and installing Tableau...for free
8 Topics
Creating our first viz
User Interface - Data Source page sheets tabs and status bar
User Interface - Side Bar Shelves and Card
Dimensions v Measures and Introducing Date Hierarchies
Explain the difference between Discrete and Continuous fields
Changing the aggregation both for a single viz or changing default aggregation
More about aggregations
Level 1: Creating our first visualizations
8 Topics
Publishing your viz
Exporting as PowerPoint
Share as image PDF and PowerPoint presentation
Additional exporting options in the full Tableau Desktop program
Error saving to Tableau Public
Practice Activity Number 1
Practice Activity Number 1 - Solution
Publishing our first visualizations
12 Topics
Tips to importing data better
Organising fields
Creating aliases
Adding multiple fields using Show Me!
Adding colors
Choosing between discrete and continuous colors
Using colors in stacked bar charts and using tooltips
Line charts
Size button
Practice Activity Number 2
Practice Activity Number 2 - Solution
Developing the Marks card
9 Topics
Scatter plots
Custom shapes bubble charts and packed bubbles
Data Highlighter
Filters card - Selecting Items
Filter card - Using wildcards conditions and top
Filtering dates and different displays of filter cards
Practice with Filters and using Context Filters
Apply filters to multiple sheets and data sources
Scatter and bubble charts data highlighter and Filtering
10 Topics
The "Play" button
Pages card
Use viz animations
Use mark labels
Use Annotations
Formatting vizzes
More about Tableau Public
Practice Activity Number 3
Practice Activity Number 3 - Solution
The Pages shelf Labels and Annotations
15 Topics
Welcome to Level 3
Creating our first dashboard
Pre-designing the layout and using floating and tiled objects
Rearranging the filters in a vertical column
Fine-tuning layout
Device Layout and Device Designer including layout for mobile devices
Dashboard filters and using a highlight as a filter
Fine-tuning dashboard actions
Creating a drill down report
Best visual practices for dashboard design
Buttons/Navigation and Export objects Renaming Dashboard Items
Build stories
Practice Activity Number 4
Practice Activity Number 4 - Solution
Dashboards
9 Topics
Navigate maps including Pan & Zoom and geographic roles
Lasso and Radial selection and grouping into custom territories
Density Maps
Map layering
Geographic search
Modifying locations within Tableau and problems
Practice Activity Number 5
Practice Activity Number 5 - Solution
Maps
10 Topics
Build hierarchies
Combining hierarchies and filters
Sorting data - an introduction
Sort data including manual sorting
Changing default field properties (types sorting etc.)
Build groups
Build sets
Practice Activity Number 6
Practice Activity Number 6 - Solution
Organizing and simplifying data
14 Topics
Utilize auto-generated fields including measure names and values
Basic chart types including area and pie chart types
Use titles captions and tooltips effectively
Using vizzes in tooltips
Edit axes
Creating bins
Histograms
Heat maps and Cross tabs
Tree maps
Combined Axis Charts and Dual Axis Charts
Scatter plots revisited
Practice Activity Number 7
Practice Activity Number 7 - Solution
Field and Chart Types
13 Topics
Instant Analytics - Constant and Average Lines
Median and Average with Confidence Intervals and Clusters
Reference Lines
Desktop Specialist certificate
Reference Bands and Reference distributions
Box plots
Bullet graphs
Statistical summary card
Create quick table calculations
Paretos
Practice Activity Number 8
Practice Activity Number 8 - Solution
Advanced Field and Chart Types with basic Analytics
10 Topics
Gantt Bar Charts
Sparklines
Creating a date calculation
Creating an arithmetic calculation and use ad-hoc calculations
Trend lines and Trend model
Forecasting
Quick table calculations using dates
Practice Activity Number 9
Practice Activity Number 9 - Solution
Gantt Bar Chart calculations and date Analytics
4 Topics
Joining tables from single data source - Relationships (Tableau 2020.2 or later)
Joining tables from single data source
Creating data source with multiple connections + replacing existing data sources
Working with data sources
12 Topics
Work with aggregation options
Build logic statements
Manipulate string calculations
Manipulate date calculations
Write type conversion functions
Build arithmetic calculations
Build grand totals and sub-totals
Formulas used in Quick Table Calculations
Create a predictive model
Practice Activity Number 10
Practice Activity Number 10 - Solution
Calculations
5 Topics
Parameters
Dynamic Parameters and using Parameters with filters
Using parameters with reference lines
Swap sheets by using parameters or sheet selector
Parameters
8 Topics
Calculating percentage of running total - Reminder
FIXED LOD
Different contexts for the FIXED LOD
Using FIXED LODs and Filters
A quick way to make FIXED LODs
Practice Activity 11
Dynamic Parameters and LODs - and a Practice Activity
Fixed Level of Detail (LOD) calculations
9 Topics
Tableau 2020.2 and later
Use calculations in join clauses
Union
Prepare Data For Analysis - Blending
Pivot and Data Interpreter
About the next two videos...
Join tables from single and multiple file types or databases
Understand how to use Automatic & Custom Split
Data Connections Part 1
7 Topics
Installing Tableau Desktop
Connect to different file types and Tableau Server
Pull data from relational databases by using custom SQL queries
Create data extracts - differences between live connections and extracts
Save metadata properties in a .TDS file
Understand Shadow extracts
Data Connections 2
6 Topics
Printing content and publishing visualization or workbook
Create extract filters connect to .hyper files and publish a data source
Schedule data extract refreshes
Create subscriptions
Create alerts
Other aspects of Tableau Desktop and Tableau Online
3 Topics
Creating a data flow
Managing editing and running data flows
Creating data flows
9 Topics
Introduction
Motion charts
Bar in bar charts
INCLUDE LOD
EXCLUDE LOD
Connect to spatial files
Import and manage custom geocoding
Use a background image map
Understand Performance Optimization
5 Topics
How to enter the official certification
Tableau Specialist Desktop and Data Analyst practice test
Tableau Certified Data Analyst Test
Well done and congratulations
Bonus Lecture

Tableau Data Analyst/Specialist Desktop Certification
Related Tableau Courses


Thank You!
Your review has been submitted successfully.