IIRF Online > Business > Operations > Lean Six Sigma Green Belt Certification > Certified Lean Six Sigma Green Belt Training (Accredited)
Certified Lean Six Sigma Green Belt Training (Accredited) by Udemy
Internationally accepted CSSGB, LSSGB Body of Knowledge + Summary Book + Certification - Get 26 PMI PDUs/PDCs/CPDs
Course Highlights
- Transform Your CSSGB, LSSGB Dreams into Reality: Join Our Proven Prep Course!
- This course is fully aligned with the Six Sigma Green Belt Body of Knowledge provided by most internationally recognized certification bodies.
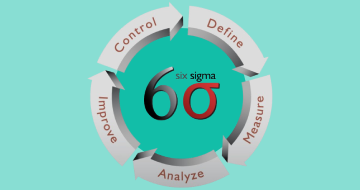
- Confidently use the DMAIC approach of improvement on a medium complexity projects.
- Support a Black Belt in the application of DMAIC approach of improvement on a large and complex projects.
Skills you will learn!
Curriculum
25 Topics
1A1 Value of Six Sigma - Introduction
1A1 Value of Six Sigma - Benefits of six sigma
Quality gurus Inc certificate and digital badge
1A1 Value of Six Sigma - Six Sigma Philosophy
1A1 Value of Six Sigma - Evolution of Six Sigma
1A2 Organizational Goals and Six Sigma Projects - Selecting a Project
1A2 Organizational Goals and Six Sigma Projects - Process
1A3 Organizational Drivers and Metrics
ASQ CSSGB 2022 Updates - SMART Goals
ASQ CSSGB 2022 Updates - KPIs
1B1 Lean Concepts - Introduction
1B1 Lean Concepts - Philosophy
1B1 Lean Concepts - Theory of Constraints (TOC)
1B2 Value Stream Mapping (VSM)
ASQ CSSGB 2022 Updates -Takt Time
ASQ CSSGB 2022 Updates -Just In Time (JIT)
ASQ CSSGB 2022 Updates - Gemba
ASQ CSSGB 2022 Updates - Spaghatti Diagram
1C1 Road map for Design for Six Sigma (DFSS)
1C2&3 Failure Mode and Effects Analysis (FMEA) - Introduction
1C2&3 FMEA - An Example
1C2&3 FMEA - Summary
ASQ CSSGB 2022 Updates - Verification and Validation
Section 1 Quiz 1: Six Sigma and the Organization
Section 1: Download pdf Handouts - Six Sigma and the Organization
55 Topics
2A1 Project Selection
2A1 Project Selection
2A2 Process Elements
2A3 Benchmarking
2A4 Process Inputs and Outputs (SIPOC)
2A5 Owners and Stakeholders
2B1 Voice of the Customer - Customer Identification
2B2 Customer Data
2B3 Customer Requirements
2B3 Quality Function Deployment (QFD)
ASQ CSSGB 2022 Updates - CTQ and CTX
ASQ CSSGB 2022 Updates - Kano Model
2C1 Project Management Basics - Project Charter
2C2 Project Scope
Minitab 18 - Plotting Pareto Charts
2C3 Project Metrics
2C4 Project Planning Tools - Gantt Chart
2C4 Critical Path Method (CPM)
2C4 Program Evaluation and Review Technique (PERT)
2C5 Project Documentation
2C6 Project Risk Analysis - Part 1
2C6 Project Risk Analysis - Part 2
2C7 Project Closure
ASQ CSSGB 2022 Updates - WBS
ASQ CSSGB 2022 Updates - Toll Gate Review
ASQ CSSGB 2022 Updates - Risk Management Definition
ASQ CSSGB 2022 Updates - Business Continuity Plan (BCP)
2C 2022 SSGB Project Methodology
2D Management and Planning Tools - 1. Affinity Diagrams
2D Management and Planning Tools - 2. Interrelationship Digraphs
2D Management and Planning Tools - 3. Tree Diagrams
2D Management and Planning Tools - 4. Prioritization Matrices
2D Management and Planning Tools - 5. Matrix Diagrams
2D Management and Planning Tools - 6. Process Decision Program Charts (PDPC)
2D Management and Planning Tools - 7. Activity Network Diagrams
ASQ CSSGB 2022 Updates - SWOT Analysis
2E1 Business Results for Project - Defects per Unit (DPU)
2E1 Business Results for Project - Rolled Throughput Yield (RTY)
2E1 Business Results for Project - Cost of Poor Quality
2E1 Business Results for Project - DPMO and Sigma Levels
2E1 Business Results for Project - Process Capability Indices
2E2 Communication
2F1 Team Stages - Tuckman's Stages of Team Development
2F1 Team Negative Dynamics - Part 1
2F1 Team Negative Dynamics - Part 2
2F1 Team Negative Dynamics - Part 3
2F2 Team Roles and Responsibilities - Part 1
2F2 Team Roles and Responsibilities - Part 2
2F3 Team Tools - Brainstorming
2F3 Team Tools - Nominal Group Technique (NGT)
2F3 Team Tools - Multivoting
2F4 Team Communication
ASQ CSSGB 2022 Updates - RACI Matrix
Section 2 Quiz 1 Define Phase
Section 2: Download pdf Handouts - Define Phase
67 Topics
3 Introduction to Measure Phase
3A Process Analysis and Documentation - Flow Charts
3A Documentation
3B1 Basic Probability Concepts - Part 1
3B1 Basic Probability Concepts - Part 2
3B1 Basic Probability Concepts - Part 3
3B1 Basic Probability Concepts - Part 4
3B1 Basic Probability Concepts - Part 5
3B2 Central Limit Theorem - Part 1
3B2 Central Limit Theorem - Part 2
Section 3 Quiz 1 - Process Analysis and Probability
3C Statistical Distributions - Binomial Distribution - Part 1
3C Binomial Distribution - Part 2
3C Poisson Distribution - Part 1
3C Poisson Distribution - Part 2
3C Normal Distribution - Part 1
3C Normal Distribution - Part 2
3C Normal Distribution - Part 3
3C Chi Square Distribution
3C t Distribution
3C F Distribution
Minitab 18 - Introduction and Plotting Statistical Distributions
Section 3 Quiz 2 - Statistical Distributions
3D1 Types of data - Continuous vs Discrete
3D1 Measurement Scales - Nominal; Ordinal; Interval and Ratio
3D2 Sampling - Introduction
3D2 Probability Sampling
3D2 Non-Probability Sampling
3D2 Checksheets to Record Data
3D2 Data Coding
3D3 Descriptive Statistics - Central Tendency (Mean; Mode and Median)
3D3 Measurements of Central Tendency - Quantile; Quartile and Percentile
3D3 Measurements of Dispersion
3D3 Frequency distributions and cumulative frequency distributions
Minitab 18 - Descriptive statistics
3D4 Graphical Methods - Scatter Diagrams
Minitab 18 - Scatter Diagrams
3D4 Graphical Methods - Histogram
Minitab 18 - Histogram
3D4 Graphical Methods - Box and Whisker Plot
Minitab 18 - Box and Whisker Plot
3D4 Graphical Methods - Stem and Leaf Plot
Minitab 18 - Stem and Leaf Plot
3D4 Graphical Methods - Normal Probability Plots
Minitab 18 - Normal Probability Plots
ASQ CSSGB 2022 Updates - Data Collection Plan
ASQ CSSGB 2022 Updates - Data Quality
Section 3 Quiz 3: Collecting and Summarizing Data
3E Measurement System Analysis (MSA) - Introduction
3E MSA - Resolution
3E - Accuracy (Bias
Linearity and Stability)
3E - Precision (Repeatability and Reproducibility - Gage R&R)
3E Precision to Tolerance Ratio (PTR)
Section 3 Quiz: Measurement System Analysis (MSA)
3F1 Process Performance vs Process specifications - Part 1
3F1 Process Performance vs Process specifications - Part 2
3F2 Process Capability Studies
3F3 Process Capability and Process Performance - Introduction
3F3 Four Conditions to Calculate Cp and Cpk
3F3 Calculating Cp and Cpk
3F3 Calculating Pp and Ppk
3F4 Understanding the Use of Cpm
Minitab 18 - Calculating Cp; Cpk; Pp; Ppk and Cpm
3F4 - Short-term vs Long-term Capability and Sigma Shift (6 Sigma = 3.4 DPMO)
Section 3 Quiz 4 : Process Performance vs Process Specification
Section 3: Download pdf Handouts - Measure Phase
66 Topics
4A1 Exploratory Data Analysis - Multi-vari Studies - Introduction
4A1 Positional and Cyclical Variation
4A1 Temporal Variation explained using Minitab 18
4A2 Correlation and Linear Regression - Introduction
4A2 Calculating Correlation Coefficient
4A2 Interpreting the Value of Correlation Coefficient
4A2 Coefficient of Determination
4A2 Correlation does not imply Causation
4A2 Regression Analysis
4A2 Demonstration of ordinary least square (OLS) method
4A2 Calculating the Regression Equation
Section 4 Quiz 1 : Exploratory Data Analysis / Correlation and Regression
4B1 Hypothesis Testing - Basics - Introduction
4B1 Statistical vs Practical Significance
4B1 Understanding the Null and Alternate Hypothesis
4B1 Hypothesis Test Explained in Simple Terms
4B1 Types of Errors in Hypothesis Testing
4B1 Types of Errors - Summary
4B1 Alpha vs Beta
4B1 Hypothesis Test Explained
4B1 Understanding Z Tables
4B1 Understanding the p Value
Section 4 Quiz 2: Hypothesis Tests - Basics
4B2 tests for mean
variance; and proportions - introduction
4B2 One Sample z Test - Conditions
4B2 one sample z test - Example
4B2 One Sample z Test - Example 2
4B2 Minitab 18 - One Sample z Test
4B2 One Sample t Test - Conditions and Example
4B2 Minitab 18 - One Sample t Test
4B2 One Proportion Test - Conditions and Examples
4B2 Minitab 18 - One Proportion Test
4B2 One Variance Test - Introduction
4B2 One Variance Test - Example 1
4B2 One Variance Test - Example 2
4B2 Minitab 18 - One Variance Test
4B2 Two Sample z Test - Introduction and Conditions
4B2 Two Sample z Test - Example
4B2 Minitab 18 - Two Sample z Test
4B2 Two Sample t Test - Conditions and Calculations
4B2 Two Sample t Test - Example with Equal Variances
4B2 Two Sample t Test - Example with Un-equal Variances
4B2 Two Sample t Test - Visual Interpretation
4B2 Minitab 18 - Two Sample t Test
4B2 Paired t Test
4B2 Minitab 18 - Paired t Test
4B2 Two Proportions Test - Introduction and Conditions
4B2 Two Proportions Test - Pooled and Unpooled Method
4B2 Two Proportions Test - Example of Pooled Method
4B2 Minitab 18 - Two Proportions Test
4B2 Two Variances Test - Introduction and Example
4B2 Minitab 18 - Two Variances Test
4B2 ANOVA - Introduction
4B2 Why ANOVA?
4B2 Understanding the concept behind ANOVA - Variation within and between
4B2 Statististics behind ANOVA
4B2 Performing ANOVA using manual calculations
4B2 Minitab 18 - One way ANOVA
4B2 Goodness of Fit Test
Minitab 18 - Goodness of Fit Test
4B2 Contingency Tables
4B2 Minitab 18 - Contingency Tables
4C 2022 SSGB Gap Analysis
Section 4 Quiz 3: Hypothesis Tests
Section 4: Download pdf Handouts - Analyze Phase
24 Topics
5 - Welcome to Improve Phase
5A1 - Design of Experiments - Introduction
5A1 - DoE Basic Terms - Part 1
5A1 - DoE Basic Terms - Part 2
5A1 - DoE Basic Terms - Part 3
5A2 - DoE Graphs and Plots - Introduction
5A2 - DoE Graphs and Plots - Interaction Chart
5A2 - DoE Graphs and Plots - Equation
5A2 - DoE Graphs and Plots - Equation with Interaction
Section 5 Quiz 1 : Design of Experiments
5B - Root Cause Analysis (RCA)
5B 2022 SSGB Implementation Planning
5C Lean Tools - Waste Elimination - Muda; Mura and Muri
5C1 Waste Elimination - 8 Types of Muda - TIMWOODS
5C1 Waste Elimination - Pull System
5C1 Waste Elimination - Kanban
5C1 Waste Elimination - 5S for Workplace Organization
5C1 Waste Elimination - Standard Work and Poka-yoke
5C2 Cycle-time Reduction - Continuous Flow
5C2 Cycle-time Reduction - Setup Reduction (SMED)
5C3 Kaizen and Kaizen Blitz
ASQ CSSGB 2022 Updates - SMED
Section 5 Quiz 2: RCA and Lean Tools
Section 5: Download pdf Handouts - Improve Phase
30 Topics
6A1 Statistical Process Control (SPC) Basics
6A1 SPC Basics - Common Causes vs Special Causes
6A2 Rational Subgrouping
6A3 Control Charts - I-MR or X-MR Chart - Introduction
Minitab 18 - I-MR Chart
6A3 I-MR or X-MR Chart - Calculating Control Limits Using MS Excel
6A3 Control Charts - Xbar R Chart
Minitab 18 - Xbar R Chart
6A3 Xbar R Chart - Calculating Control Limits Using MS Excel
6A3 Control Charts - Xbar S Chart
Minitab 18 - Xbar S Chart and Excel to Calculate Control Limits
6A3 Control Charts - np Chart
Minitab 18 - np Chart and Excel to Calculate Control Limits
6A3 Control Charts - p Chart
Minitab 18 - p Chart and Excel to Calculate Control Limits
6A3 Control Charts - c Chart
Minitab 18 - c Chart and Excel to Calculate Control Limits
6A3 Control Charts - u Chart
Minitab 18 - u Chart and Excel to Calculate Control Limits
6A3 Analyzing Control Charts - Nelson Rules
6A3 Minitab 18 - Nelson Rules
6B Control Plan
6B 2022 SSGB Sustain Improvements
6C1 Total Preventive Maintenance (TPM)
6C2 Visual Factory
ASQ CSSGB 2022 Updates - Predictive Maintenance
ASQ CSSGB 2022 Updates - Jidoka
Section 6 Quiz: Control Phase
Section 6: Download pdf Handouts - Control Phase
Download pdf Handouts for the Full Course

Certified Lean Six Sigma Green Belt Training (Accredited)

.webp)


