IIRF Online > Finance & Accounting > Money Management Tools > Excel Analytics > Advance Analytics with Excel - data analysis toolpak/ Solver
Advance Analytics with Excel - data analysis toolpak/ Solver by Udemy
Advanced data analysis in excel: Data Analysis tools (toolpak add-in) for statistics / solver for linear optimization
Course Highlights
- Perform Data Analysis / Statistical Analysis using Excel
- Be comfortable with data analysis tool pack / solver / goal seek
- Understand the business context / scenario where the statistical procedure is applicable
- Understand the most important portion of statistical procedure output and how to interpret it for a given scenario
- Know how to solve linear programming cases using solver
Skills you will learn!
Curriculum
23 Topics
Course Content
Descriptive Statistics for Numerical Data Analysis
Excel files - where they are?
Interpret Descriptive statistics output
Pivot Table Analysis - count and percentage for each distinct category
Additional Topic - Creating BI kind of dashboard using Excel Pivot table part 01
Additional Topic - Creating BI kind of dashboard using Excel Pivot table part 02
Category wise Numeric data analysis using Pivot table
Cross tab Analysis
Chi Square Test of independence
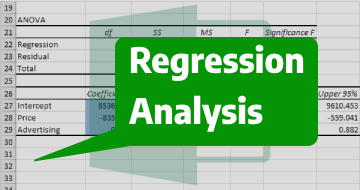
Simple Linear Regression
Multiple Linear Regression
Comparing Two Sample Variances
Comparing Two Sample Means
Pair T Test
One Factor (One Way) ANOVA
Two Factor ANOVA without replication
Two Factor ANOVA with replication
Generating Random Numbers which has Normal / Poison / Uniform etc. Distribution
Rank and Percentile calculation
Histogram Procedure and Getting Pareto Chart
Exponential Smoothing and Moving Average
Random Sampling Co-variance and Correlation procedure
2 Topics
Goal Seek Example
Solving a puzzle using Goal Seek
3 Topics
Example 1 - using solver for linear programming case
Example 2 - using solver for linear programming case
How to download Excel files

Advance Analytics with Excel - data analysis toolpak/ Solver
Related Excel Analytics Courses


Thank You!
Your review has been submitted successfully.